Mailing List ArchivesPublic Access |
|
Mailing List ArchivesPublic Access |
|
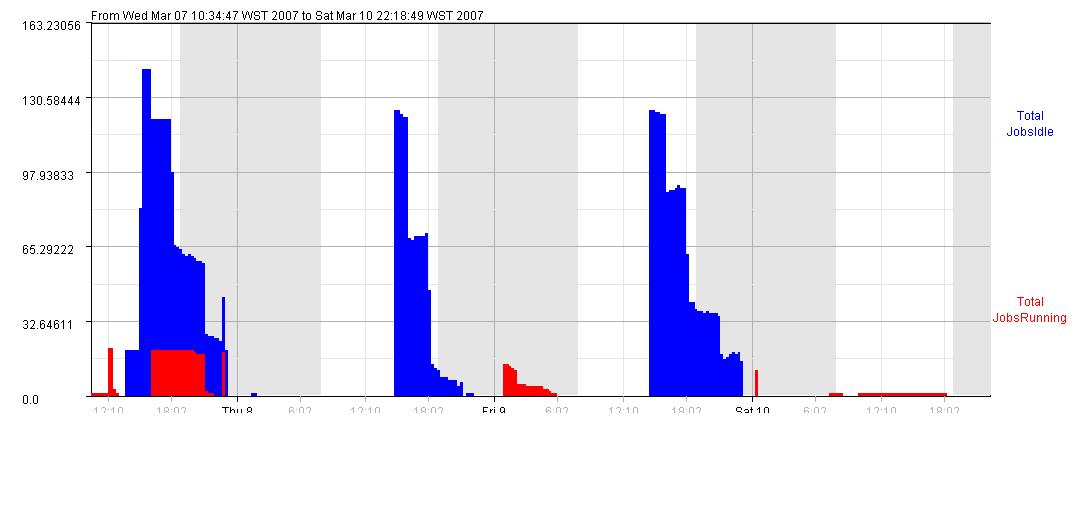
Hi All

We've been running condor for ~2 years now, and when I prepare my
monthly stats for "admin" I do it manually by using condor_history
on the various submit machine's history files, i.e. info such as
total number of jobs and total no. of CPU hours used.

I do this as the condorview stats don't seem to accurately reflect
what's going on. e.g. the attached jobs.jpg file is a clumsy attempt to
show what I think "should" be displayed in the graphs.

Jobs are submitted at time A and sit there waiting until after hours
(our config) to run. At time B some start running and more and more
do until all are running. Note that the "total" no. of jobs should
remain constant, whatever are not idle are running. Assuming all run
for the same amount of time then the graph of all running jobs in red
should then tail off as they are completed.

In reality we get graphs like the second attachment: jobs_actual.jpg

Now these are just based on output from the condor_stats command which
gives the same (in text format) data.

I get large (3-5 times differences) between what condorview says and
what condor_history says, and as the graphs are there for all to see,
I am getting some questions from admin re the monthly stats I am giving
them.

BTW our setup is state-based, multiple pools, Australia-wide all
reporting to the one condorview server. Is it just a case of too
many dropped UDP packets (although netstat -su doesn't seem to support
that), or some other issue?

Has anyone else had these problems?

Thanks.

Cheers

Greg
Attachment:
jobs.JPG
Description: jobs.JPG
Attachment:
jobs_actual.JPG
Description: jobs_actual.JPG